Complete User Guide for soilsampling Package
soilsampling package
2025-12-26
Source:vignettes/user-guide.Rmd
user-guide.RmdIntroduction
The soilsampling package provides comprehensive tools for designing soil sampling schemes in R. This guide demonstrates all available functions with practical code examples.
Installation
# Install from local source
install.packages("soilsampling", repos = NULL, type = "source")

# Or using devtools
devtools::install_local("path/to/soilsampling")
Load Package
library(soilsampling)
library(sf)
#> Linking to GEOS 3.12.1, GDAL 3.8.4, PROJ 9.4.0; sf_use_s2() is TRUE

# Set seed for reproducibility
set.seed(42)1. Stratification Functions
1.1 ss_stratify() - Create Compact Strata
Creates compact geographical strata using k-means clustering.
Basic Usage:
# Create 25 compact strata
strata <- ss_stratify(study_area, n_strata = 25, n_try = 5)

# View structure
print(strata)
#> Soil Sampling Stratification
#> ============================
#> Number of strata: 25
#> Number of cells: 2485
#> Cell size: 1.41 x 1.41
#> MSSD: 42.0403
#> Converged: TRUE
#> Equal area: FALSE
With Equal-Area Strata:
# Create 20 equal-area strata
strata_equal <- ss_stratify(
  study_area,
  n_strata = 20,
  equal_area = TRUE,
  n_try = 5
)
With Prior Points:
# Existing sample locations
prior_pts <- st_as_sf(
  data.frame(x = c(25, 75), y = c(25, 25)),
  coords = c("x", "y")
)

# Create stratification around prior points
strata_prior <- ss_stratify(
  study_area,
  n_strata = 20,
  prior_points = prior_pts,
  n_try = 5
)
Advanced Parameters:
# Fine-tune stratification
strata_custom <- ss_stratify(
  study_area,
  n_strata = 30,
  n_cells = 2500,      # Higher resolution grid
  n_try = 10,          # More attempts to find optimal
  equal_area = FALSE,
  verbose = TRUE
)
#> 2025-12-26 02:33:22 | Optimizing configuration 1
#>     Current MSSD: 33.7103
#>     Best MSSD: 33.7103
#> 2025-12-26 02:33:22 | Optimizing configuration 2
#>     Current MSSD: 36.4875
#>     Best MSSD: 33.7103
#> 2025-12-26 02:33:22 | Optimizing configuration 3
#>     Current MSSD: 34.0026
#>     Best MSSD: 33.7103
#> 2025-12-26 02:33:22 | Optimizing configuration 4
#>     Current MSSD: 37.1821
#>     Best MSSD: 33.7103
#> 2025-12-26 02:33:22 | Optimizing configuration 5
#>     Current MSSD: 35.1059
#>     Best MSSD: 33.7103
#> 2025-12-26 02:33:22 | Optimizing configuration 6
#>     Current MSSD: 41.1071
#>     Best MSSD: 33.7103
#> 2025-12-26 02:33:22 | Optimizing configuration 7
#>     Current MSSD: 40.3993
#>     Best MSSD: 33.7103
#> 2025-12-26 02:33:22 | Optimizing configuration 8
#>     Current MSSD: 35.2979
#>     Best MSSD: 33.7103
#> 2025-12-26 02:33:22 | Optimizing configuration 9
#>     Current MSSD: 36.664
#>     Best MSSD: 33.7103
#> 2025-12-26 02:33:22 | Optimizing configuration 10
#>     Current MSSD: 42.7942
#>     Best MSSD: 33.7103
2. Sampling Functions
2.1 ss_random() - Simple Random Sampling
Generates random sampling points uniformly distributed across the study area.
Basic Usage:
# Select 30 random points
samples_random <- ss_random(study_area, n = 30)
print(samples_random)
#> Simple Random Sampling
#> ======================
#> Number of samples: 30
With Seed for Reproducibility:
# Reproducible random sampling
samples_random_rep <- ss_random(study_area, n = 25, seed = 123)
2.2 ss_stratified() - Stratified Random Sampling
Random sampling within each stratum.
Basic Usage:
# Create strata first
strata <- ss_stratify(study_area, n_strata = 25, n_try = 5)

# Sample 1 point per stratum
samples_strat <- ss_stratified(strata, n_per_stratum = 1)
print(samples_strat)
#> Stratified Random Sampling
#> ==========================
#> Number of samples: 25
#> Number of strata: 25
#> Samples per stratum: 1
Multiple Points per Stratum:
# Sample 2 points per stratum
samples_strat2 <- ss_stratified(strata, n_per_stratum = 2, seed = 456)
With Different Seed:
# Different random realization
samples_strat3 <- ss_stratified(strata, n_per_stratum = 1, seed = 789)
2.3 ss_coverage() - Spatial Coverage Sampling
Purposive sampling at stratum centroids for optimal spatial coverage.
From Strata Object:
# Use pre-computed strata
strata <- ss_stratify(study_area, n_strata = 25, n_try = 5)
samples_cov <- ss_coverage(strata)
print(samples_cov)
#> Spatial Coverage Sampling
#> =========================
#> Number of samples: 25
#> Number of strata: 25
Direct Approach:
# All-in-one: stratify and sample
samples_cov_direct <- ss_coverage(
  study_area,
  n_strata = 20,
  n_try = 5
)
With Prior Points:
# Prior points marked differently
prior_pts <- st_as_sf(
  data.frame(x = c(50), y = c(25)),
  coords = c("x", "y")
)

strata_prior <- ss_stratify(
  study_area,
  n_strata = 24,
  prior_points = prior_pts,
  n_try = 5
)

samples_prior <- ss_coverage(strata_prior)
2.4 ss_coverage_equal_area() - Equal-Area Coverage
Sampling
Coverage sampling with strata of equal size.
Basic Usage:
# Create 25 equal-area strata and sample
samples_eq <- ss_coverage_equal_area(
  study_area,
  n_strata = 25,
  n_try = 5
)
print(samples_eq)
#> Spatial Coverage Sampling (Equal Area)
#> ======================================
#> Number of samples: 25
#> Number of strata: 25
Custom Parameters:
# Fine-tuned equal-area sampling
samples_eq_custom <- ss_coverage_equal_area(
  study_area,
  n_strata = 30,
  n_cells = 3000,
  n_try = 10
)
2.5 ss_maxvol() - Maxvol Optimal Design Sampling
Feature-based sampling using D-optimal experimental design.
With sf Object and Features:
# Create grid with features
strata <- ss_stratify(study_area, n_strata = 100, n_try = 3)
cells_sf <- strata$cells

# Add terrain-like features
coords <- st_coordinates(cells_sf)
cells_sf$elevation <- coords[,2] + rnorm(nrow(coords), 0, 5)
cells_sf$slope <- abs(rnorm(nrow(coords), 5, 2))
cells_sf$twi <- rnorm(nrow(coords), 8, 1.5)

# Select optimal samples based on features
samples_maxvol <- ss_maxvol(
  cells_sf,
  n = 20,
  features = c("elevation", "slope", "twi"),
  normalize = TRUE,
  add_coords = TRUE
)
print(samples_maxvol)
#> NA
#> NA
#> Number of samples: 20
With Feature Matrix:
# Custom feature matrix
n_loc <- 100
feature_mat <- matrix(
  c(
    rnorm(n_loc, 100, 10),   # elevation
    abs(rnorm(n_loc, 5, 2)),  # slope
    rnorm(n_loc, 8, 1.5)      # TWI
  ),
  ncol = 3
)
colnames(feature_mat) <- c("elevation", "slope", "twi")

coords_mat <- cbind(
  x = runif(n_loc, 0, 100),
  y = runif(n_loc, 0, 50)
)

samples_maxvol_mat <- ss_maxvol(
  feature_mat,
  n = 15,
  coords = coords_mat,
  normalize = TRUE,
  seed = 789
)
With Minimum Distance Constraint:
# Prevent spatial clustering
samples_maxvol_dist <- ss_maxvol(
  cells_sf,
  n = 15,
  features = c("elevation", "slope", "twi"),
  min_dist = 8,        # Minimum 8 units between samples
  normalize = TRUE,
  add_coords = TRUE
)
Advanced Options:
# Fine-tune maxvol algorithm
samples_maxvol_adv <- ss_maxvol(
  cells_sf,
  n = 25,
  features = c("elevation", "slope"),
  min_dist = 5,
  normalize = TRUE,
  add_coords = FALSE,   # Don't include coordinates
  tol = 1.2,            # Convergence tolerance
  max_iters = 200,      # Maximum iterations
  verbose = TRUE,
  seed = 999
)
#> Normalized features
#> Running maxvol algorithm...
#> Maxvol converged in 1 iterations
2.6 ss_composite() - Composite Sampling
Sampling for combining samples from multiple locations.
Basic Usage:
# Create 3 composite samples from 20 strata
samples_comp <- ss_composite(
  study_area,
  n_strata = 20,
  n_composites = 3
)
print(samples_comp)
#> Composite Sampling
#> ==================
#> Number of samples: 60
#> Number of strata: 20
#> Number of composites: 3
#> Samples per stratum: 3
More Composites:
# Create 5 composite samples
samples_comp5 <- ss_composite(
  study_area,
  n_strata = 30,
  n_composites = 5,
  n_try = 10
)
3. Visualization Functions
3.1 ss_plot() - Plot Strata and/or Samples
Main plotting function for stratification and samples.
Plot Strata Only:
strata <- ss_stratify(study_area, n_strata = 25, n_try = 5)
ss_plot(strata)
Plot Strata with Samples:
samples <- ss_stratified(strata, n_per_stratum = 1)
ss_plot(strata, samples = samples)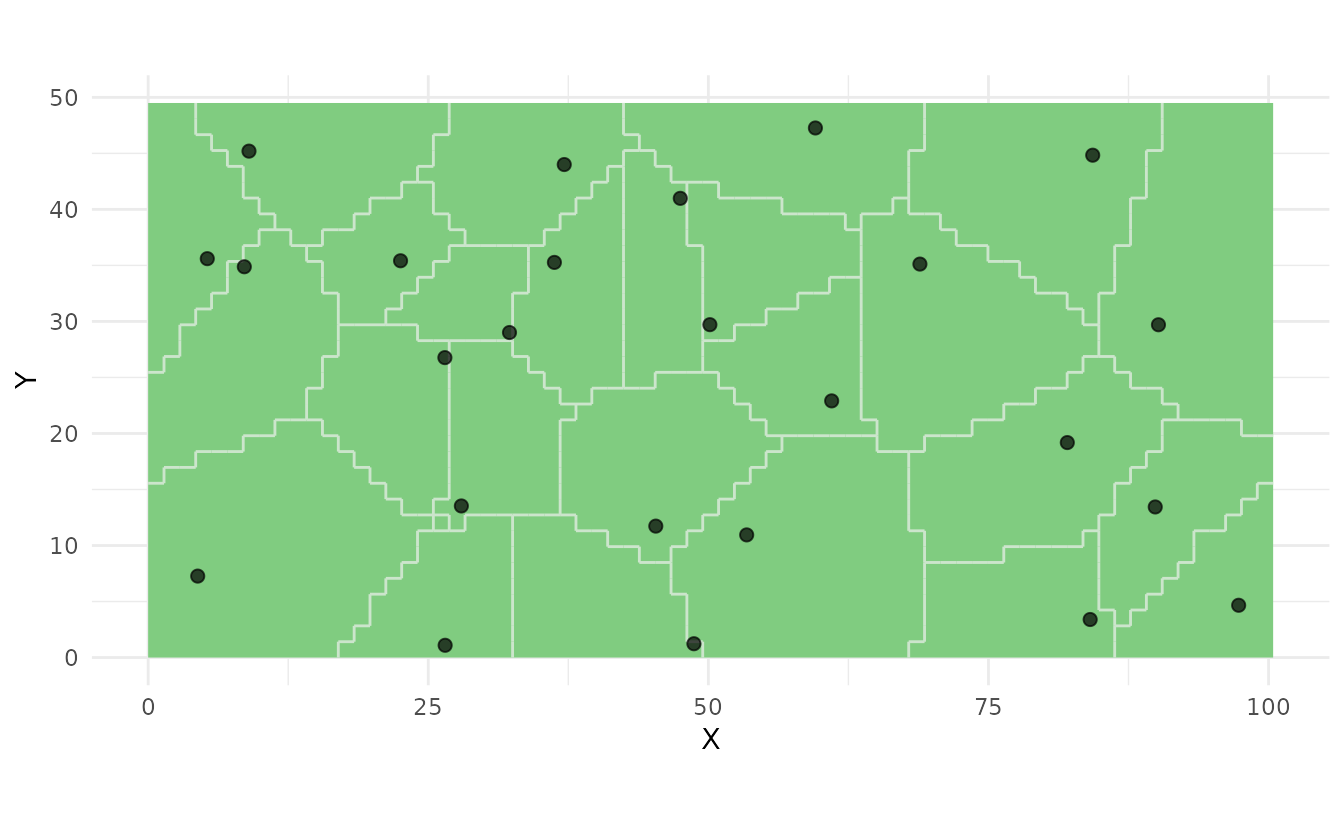
Plot with Prior Points:
prior_pts <- st_as_sf(
  data.frame(x = c(25, 75), y = c(25, 25)),
  coords = c("x", "y")
)

strata_prior <- ss_stratify(
  study_area,
  n_strata = 23,
  prior_points = prior_pts,
  n_try = 5
)

samples_prior <- ss_coverage(strata_prior)
ss_plot(strata_prior, samples = samples_prior)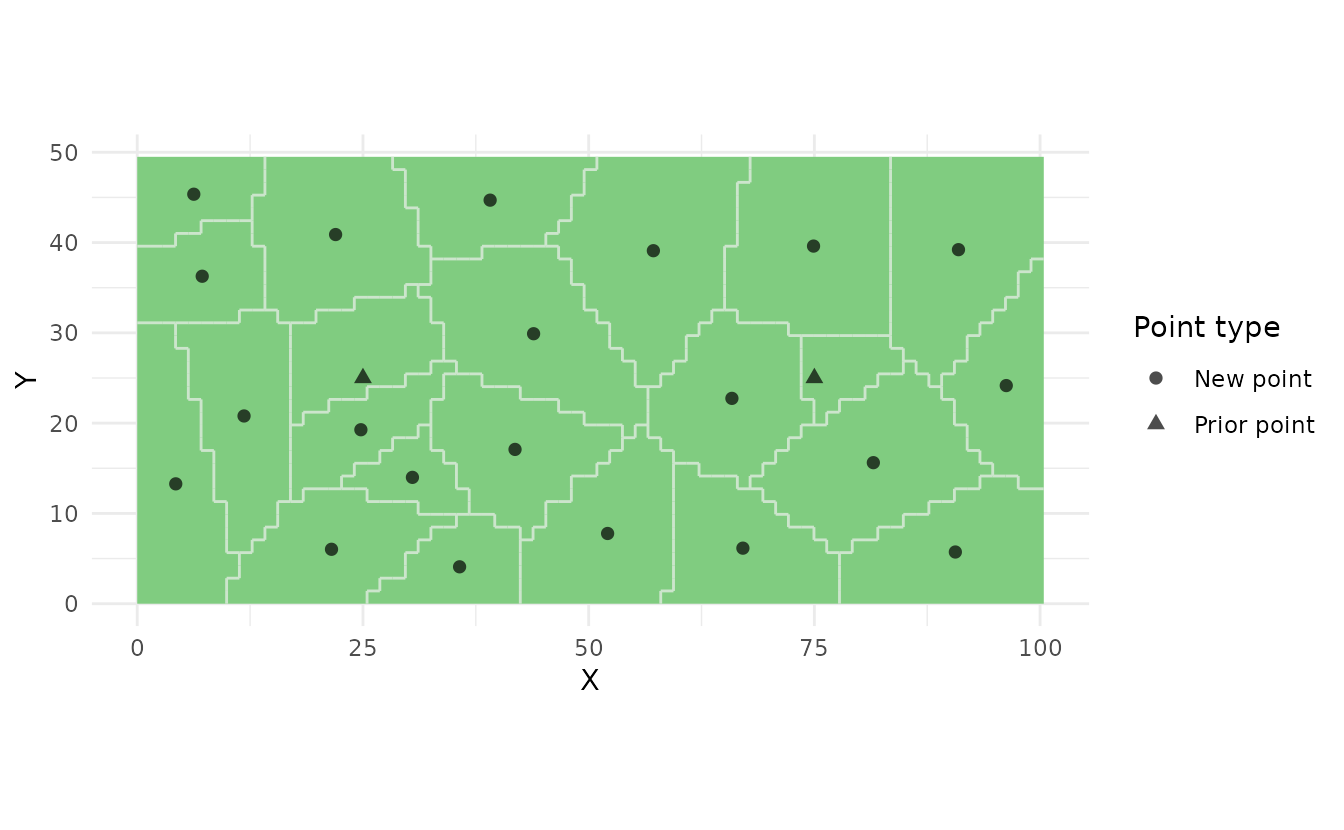
3.2 ss_plot_samples() - Plot Samples Only
Plot sampling points without stratification.
Basic Usage:
samples <- ss_random(study_area, n = 30)
ss_plot_samples(samples)
Composite Samples:
samples_comp <- ss_composite(study_area, n_strata = 20, n_composites = 3)
ss_plot_samples(samples_comp)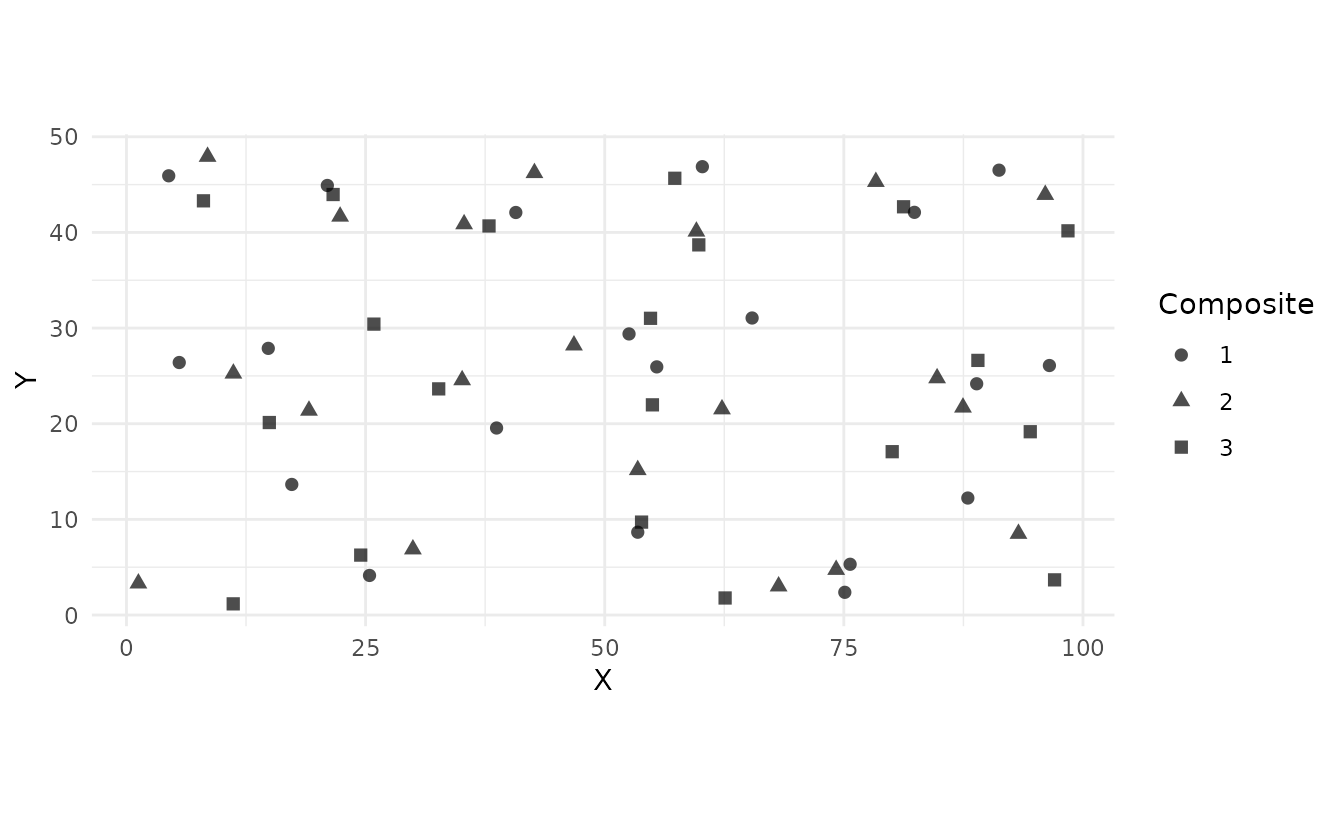
3.3 plot() - S3 Plot Methods
Generic plot methods for ss_strata and ss_samples objects.
Plot Strata:
strata <- ss_stratify(study_area, n_strata = 20, n_try = 5)
plot(strata)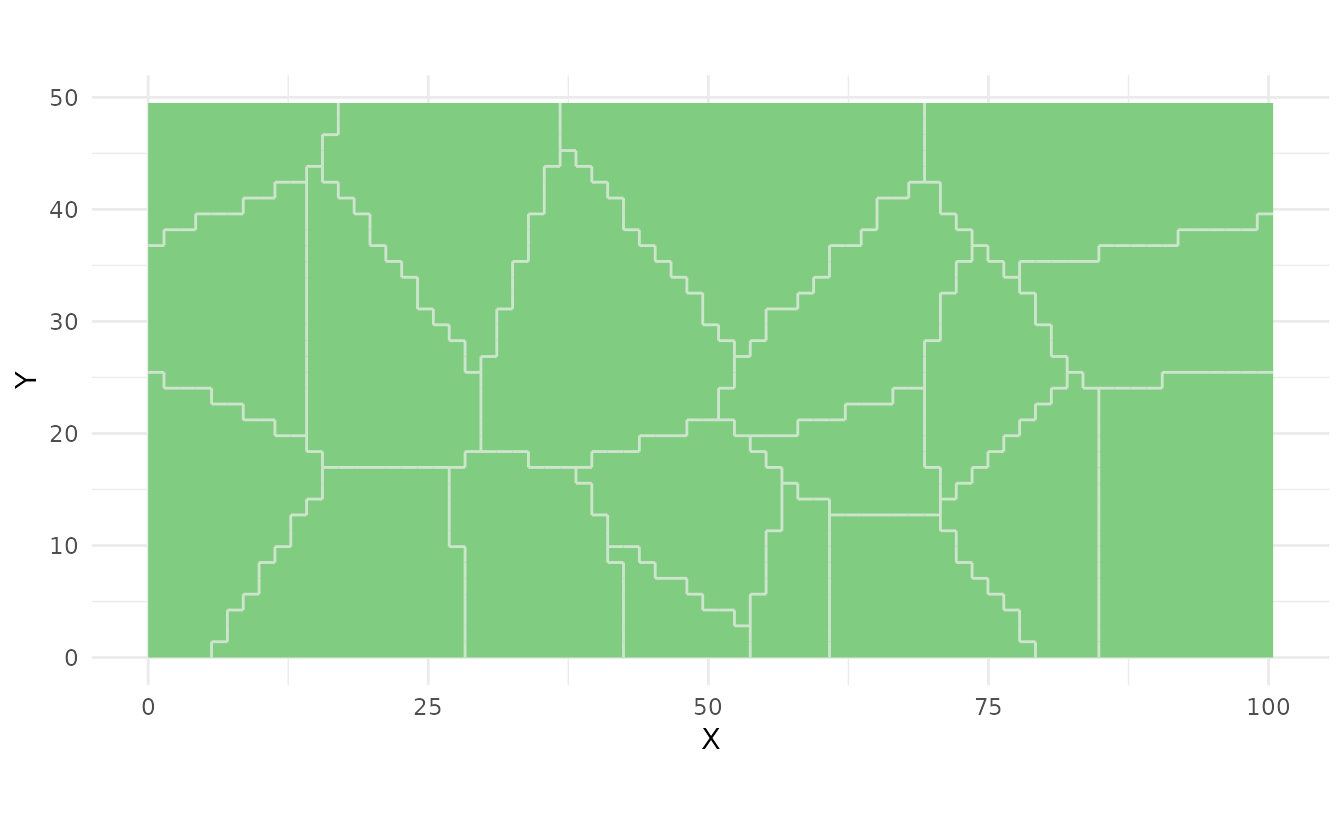
Plot Samples:
samples <- ss_coverage(study_area, n_strata = 25, n_try = 5)
plot(samples)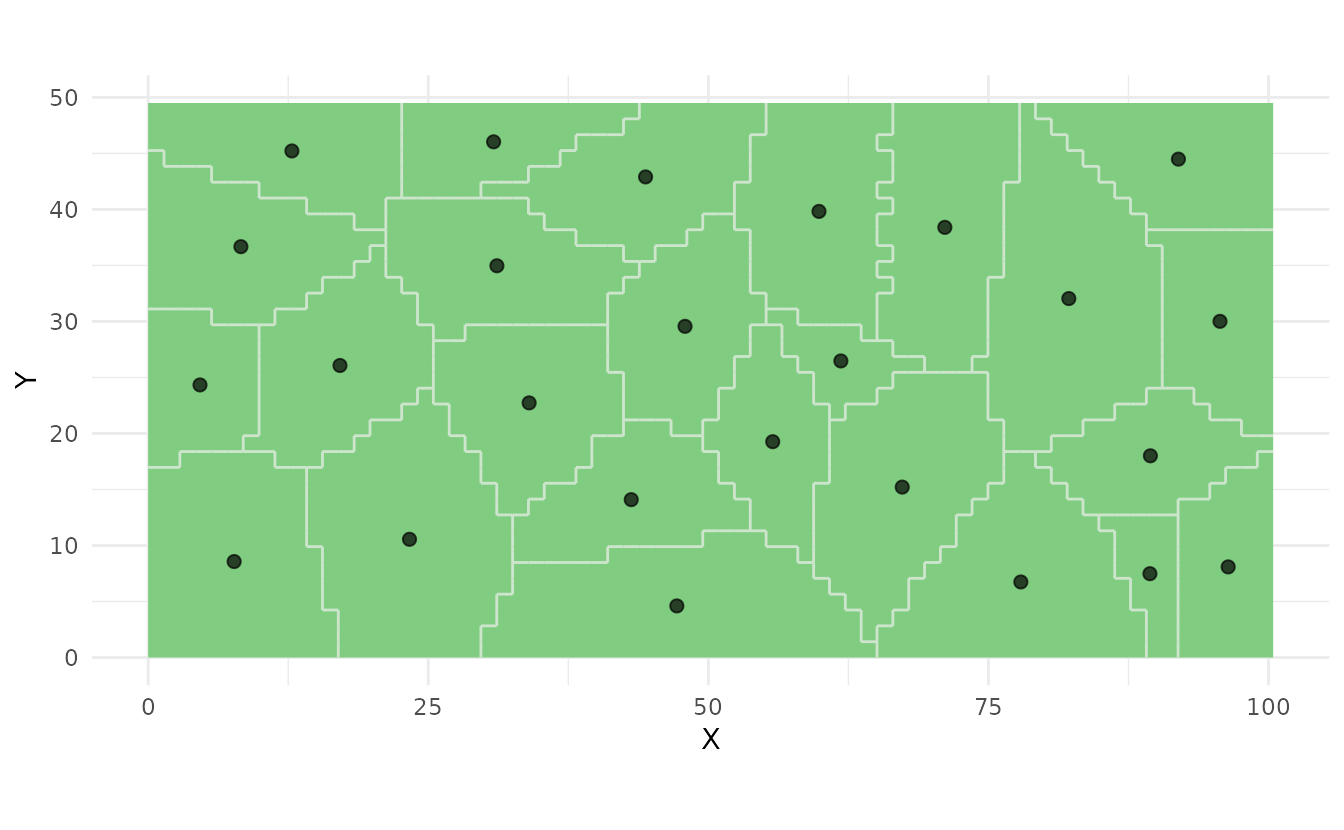
4. Summary and Information Functions
4.1 ss_summary() - Get Summary Statistics
Comprehensive summary of stratification or sampling results.
For Strata:
strata <- ss_stratify(study_area, n_strata = 25, n_try = 5)
summary(strata)
#> Soil Sampling Stratification Summary
#> =====================================
#>
#> Strata:
#>   Number of strata: 25
#>   Total cells: 2485
#>   Cells per stratum (mean): 99.4
#>   Cells per stratum (range): 31 - 193
#>
#> Algorithm:
#>   Equal area: FALSE
#>   Converged: TRUE
#>   MSSD: 39.6099
#>
#> Area:
#>   Cell size: 1.41 x 1.41
#>   Total area: 4970
For Samples:
samples <- ss_coverage(strata)
summary_samples <- ss_summary(samples)
print(summary_samples)
#>     method n_samples    x_min    x_max    y_min    y_max n_strata     mssd
#> 1 coverage        25 3.760522 95.12796 3.307435 46.57349       25 39.60994
#>   equal_area
#> 1      FALSE
4.2 ss_summary.maxvol() - Maxvol Summary
Special summary for maxvol sampling results.
# Create grid with features
strata <- ss_stratify(study_area, n_strata = 100, n_try = 3)
cells_sf <- strata$cells
coords <- st_coordinates(cells_sf)
cells_sf$elevation <- coords[,2] + rnorm(nrow(coords), 0, 5)
cells_sf$slope <- abs(rnorm(nrow(coords), 5, 2))

samples_maxvol <- ss_maxvol(
  cells_sf,
  n = 20,
  features = c("elevation", "slope"),
  normalize = TRUE
)

# Get maxvol-specific summary
summary_maxvol <- ss_summary.maxvol(samples_maxvol)
#> Maxvol Optimal Design Sampling - Summary
#> =========================================
#>
#> Samples:
#>   Total samples: 20
#>   X range: 0.71 - 26.16
#>   Y range: 0.71 - 44.55
#>
#> Maxvol Algorithm:
#>   Features used: 4
#>   Feature names: elevation, slope, X, Y
#>   Converged: TRUE
#>   Iterations: 2
print(summary_maxvol)
#> NA
#> NA
#> Number of samples: 20
4.3 print() - Print Objects
Print Strata:
strata <- ss_stratify(study_area, n_strata = 20, n_try = 5)
print(strata)
#> Soil Sampling Stratification
#> ============================
#> Number of strata: 20
#> Number of cells: 2485
#> Cell size: 1.41 x 1.41
#> MSSD: 52.6047
#> Converged: TRUE
#> Equal area: FALSE
Print Samples:
samples <- ss_random(study_area, n = 25)
print(samples)
#> Simple Random Sampling
#> ======================
#> Number of samples: 25
4.4 summary() - Generic Summary
Summary of Strata:
strata <- ss_stratify(study_area, n_strata = 25, n_try = 5)
summary(strata)
#> Soil Sampling Stratification Summary
#> =====================================
#>
#> Strata:
#>   Number of strata: 25
#>   Total cells: 2485
#>   Cells per stratum (mean): 99.4
#>   Cells per stratum (range): 27 - 170
#>
#> Algorithm:
#>   Equal area: FALSE
#>   Converged: TRUE
#>   MSSD: 40.4696
#>
#> Area:
#>   Cell size: 1.41 x 1.41
#>   Total area: 4970
Summary of Samples:
samples <- ss_coverage(strata)
summary(samples)
#> Spatial Coverage Sampling  - Summary
#> ===================================
#>
#> Samples:
#>   Total samples: 25
#>   X range: 4.12 - 95.53
#>   Y range: 4.14 - 44.85
#>
#> Stratification:
#>   Number of strata: 25
#>   Equal area: FALSE
#>   MSSD: 40.4696
5. Utility Functions
5.1 ss_n_strata() - Get Number of Strata
strata <- ss_stratify(study_area, n_strata = 25, n_try = 5)
n_strata <- ss_n_strata(strata)
print(n_strata)
#> [1] 25
5.2 ss_n_samples() - Get Number of Samples
samples <- ss_random(study_area, n = 30)
n_samples <- ss_n_samples(samples)
print(n_samples)
#> [1] 30
5.3 ss_get_samples() - Extract Samples as sf
Object
samples <- ss_coverage(study_area, n_strata = 20, n_try = 5)
samples_sf <- ss_get_samples(samples)
head(samples_sf)
#> Simple feature collection with 6 features and 3 fields
#> Geometry type: POINT
#> Dimension:     XY
#> Bounding box:  xmin: 11.13327 ymin: 8.278927 xmax: 51.83682 ymax: 41.51285
#> CRS:           NA
#>   sample_id stratum_id is_prior                  geometry
#> 1         1          1    FALSE POINT (37.16239 24.66074)
#> 2         2          2    FALSE  POINT (45.3529 41.51285)
#> 3         3          3    FALSE POINT (51.83682 11.90296)
#> 4         4          4    FALSE POINT (22.81176 8.278927)
#> 5         5          5    FALSE  POINT (11.13327 16.8584)
#> 6         6          6    FALSE POINT (11.90231 37.75318)
5.4 ss_to_sf() - Convert to sf Object
samples <- ss_random(study_area, n = 25)
samples_sf <- ss_to_sf(samples)
class(samples_sf)
#> [1] "sf"         "data.frame"
head(samples_sf)
#> Simple feature collection with 6 features and 1 field
#> Geometry type: POINT
#> Dimension:     XY
#> Bounding box:  xmin: 11.2348 ymin: 0.2503823 xmax: 54.97829 ymax: 35.30538
#> CRS:           NA
#>   sample_id                   geometry
#> 1         1 POINT (43.70442 0.2503823)
#> 2         2  POINT (54.97829 30.98729)
#> 3         3   POINT (11.2348 35.30538)
#> 4         4  POINT (16.84822 25.71406)
#> 5         5  POINT (35.64097 5.585776)
#> 6         6   POINT (19.2194 19.65943)
5.5 ss_to_data_frame() - Convert to Data Frame
Extract coordinates and attributes as a data frame.
samples <- ss_coverage(study_area, n_strata = 20, n_try = 5)
coords_df <- ss_to_data_frame(samples)
head(coords_df)
#>   sample_id stratum_id is_prior        X        Y
#> 1         1          1    FALSE 84.23966 34.35649
#> 2         2          2    FALSE 13.51237 36.95738
#> 3         3          3    FALSE 10.85043 12.83033
#> 4         4          4    FALSE 27.93978 16.87991
#> 5         5          5    FALSE 93.03009 10.02530
#> 6         6          6    FALSE 30.85343 43.62849
5.6 ss_area() - Get Stratum Areas
strata <- ss_stratify(study_area, n_strata = 25, n_try = 5)
areas <- ss_area(strata)
head(areas)
#>   1   2   3   4   5   6
#> 348 266 194 182 270  98
5.7 ss_relative_area() - Get Relative Stratum
Areas
strata <- ss_stratify(study_area, n_strata = 25, n_try = 5)
rel_areas <- ss_relative_area(strata)
head(rel_areas)
#>          1          2          3          4          5          6
#> 0.02535211 0.03259557 0.03460765 0.04507042 0.03098592 0.03420523
sum(rel_areas)  # Should sum to 1
#> [1] 1
6. Complete Workflows
6.1 Workflow 1: Simple Random Sampling
# 1. Create study area
study_area <- st_sf(geometry = st_sfc(
  st_polygon(list(rbind(
    c(0, 0), c(100, 0), c(100, 50), c(0, 50), c(0, 0)
  )))
))

# 2. Generate random samples
set.seed(42)
samples <- ss_random(study_area, n = 30)

# 3. Visualize
ss_plot_samples(samples)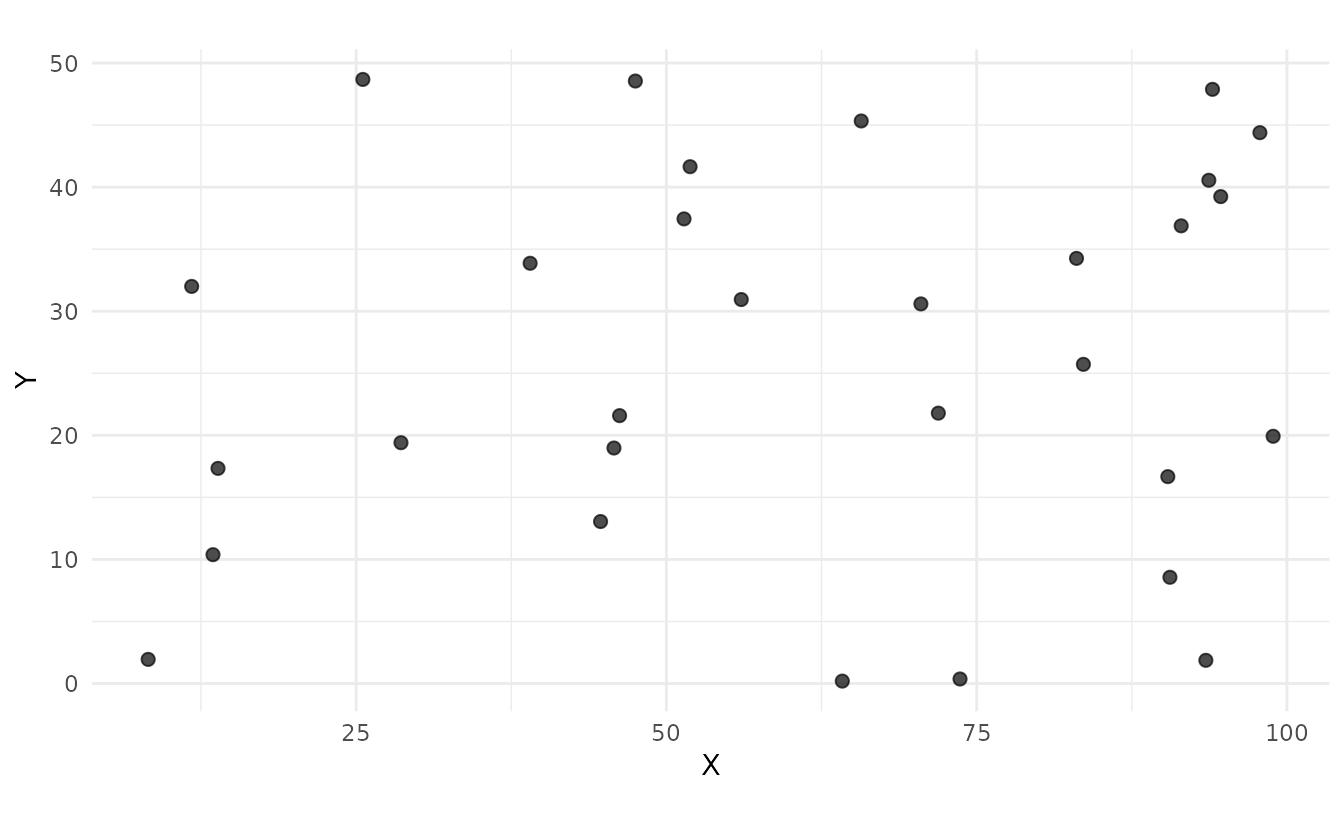
# 4. Export coordinates
coords <- ss_to_data_frame(samples)
head(coords)
#>   sample_id        X          Y
#> 1         1 91.48060 36.8797809
#> 2         2 93.70754 40.5527571
#> 3         3 28.61395 19.4054141
#> 4         4 83.04476 34.2584865
#> 5         5 64.17455  0.1974169
#> 6         6 51.90959 41.6458040

# 5. Get summary
summary(samples)
#> Simple Random Sampling  - Summary
#> ================================
#>
#> Samples:
#>   Total samples: 30
#>   X range: 8.24 - 98.89
#>   Y range: 0.2 - 48.68
6.2 Workflow 2: Stratified Sampling
# 1. Create compact strata
set.seed(123)
strata <- ss_stratify(study_area, n_strata = 25, n_try = 5)

# 2. Sample within strata
samples <- ss_stratified(strata, n_per_stratum = 1)

# 3. Visualize
ss_plot(strata, samples = samples)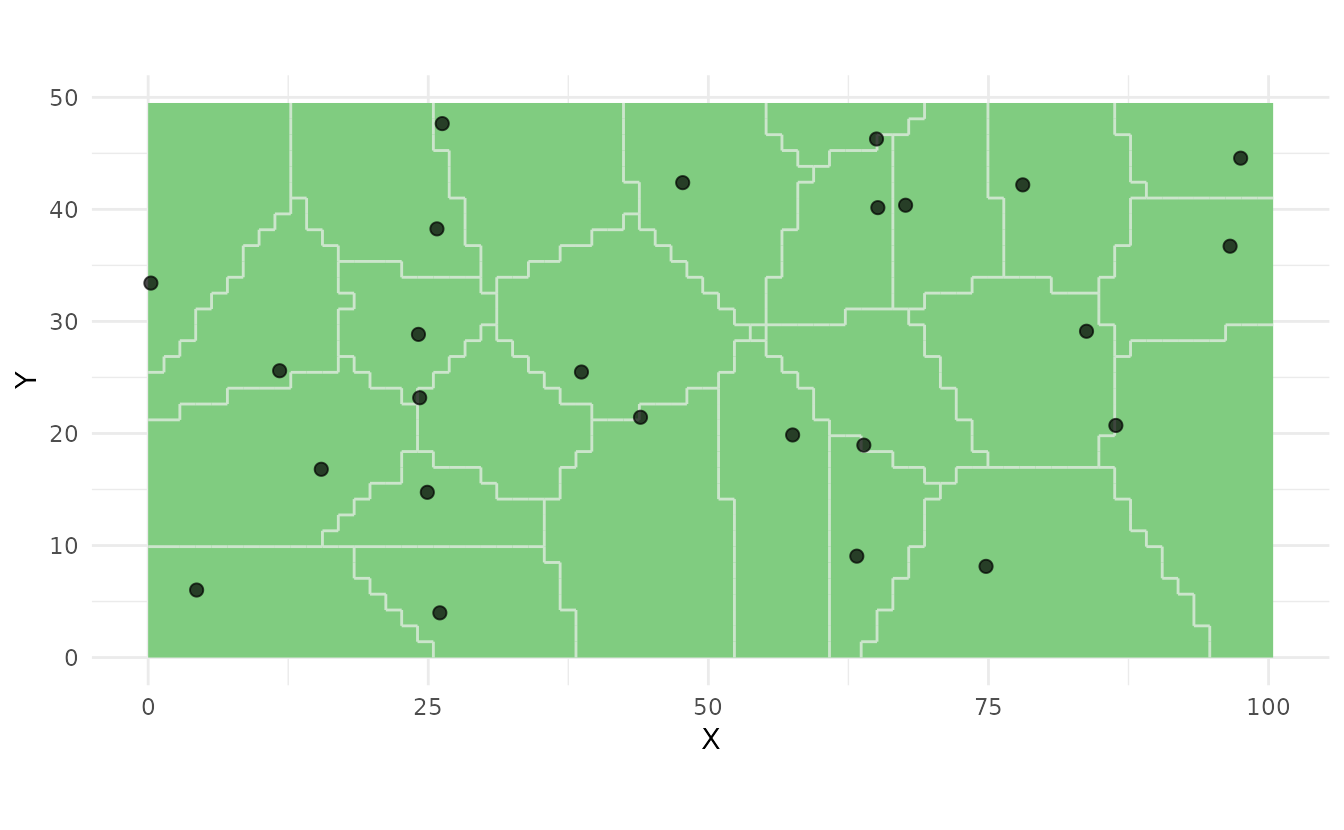
# 4. Get information
print(paste("Number of strata:", ss_n_strata(strata)))
#> [1] "Number of strata: 25"
print(paste("Number of samples:", ss_n_samples(samples)))
#> [1] "Number of samples: 25"

# 5. Check stratum areas
areas <- ss_area(strata)
print(paste("Area range:", round(min(areas), 2), "-", round(max(areas), 2)))
#> [1] "Area range: 54 - 386"
6.3 Workflow 3: Spatial Coverage Sampling
# 1. All-in-one approach
set.seed(456)
samples <- ss_coverage(study_area, n_strata = 30, n_try = 10)

# 2. Visualize
plot(samples)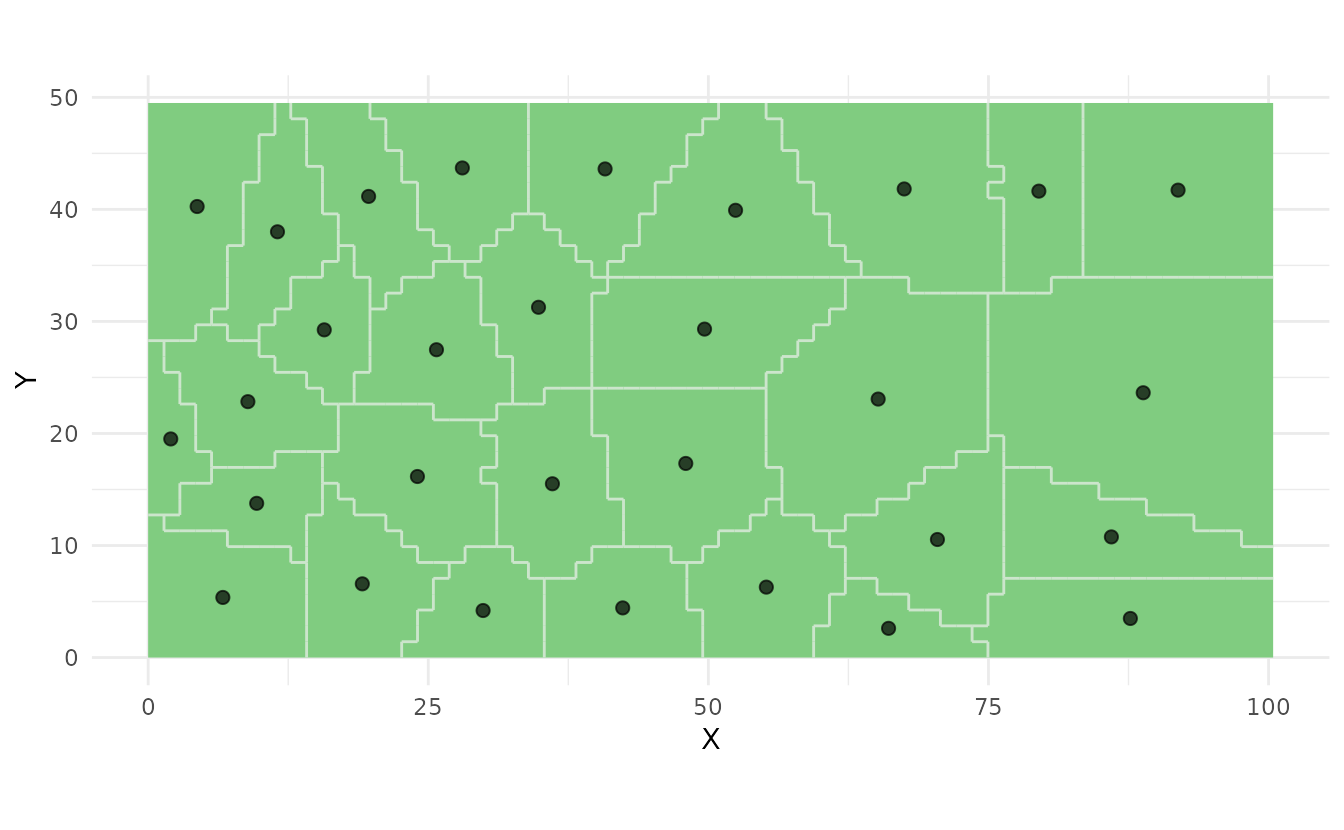
# 3. Get summary statistics
summary_info <- ss_summary(samples)
print(summary_info)
#>     method n_samples    x_min    x_max    y_min   y_max n_strata     mssd
#> 1 coverage        30 2.016564 91.92388 2.606194 43.6992       30 35.63954
#>   equal_area
#> 1      FALSE

# 4. Export as sf object
samples_sf <- ss_to_sf(samples)

# Write to file (example)
# st_write(samples_sf, "samples.gpkg")
6.4 Workflow 4: Maxvol Optimal Design
# 1. Create grid with features
strata <- ss_stratify(study_area, n_strata = 100, n_try = 5)
cells <- strata$cells

# 2. Add terrain features
coords <- st_coordinates(cells)
cells$elevation <- coords[,2] + rnorm(nrow(coords), 0, 5)
cells$slope <- abs(rnorm(nrow(coords), 5, 2))
cells$aspect <- runif(nrow(coords), 0, 360)
cells$twi <- rnorm(nrow(coords), 8, 1.5)

# 3. Select optimal samples
set.seed(789)
samples <- ss_maxvol(
  cells,
  n = 25,
  features = c("elevation", "slope", "aspect", "twi"),
  min_dist = 5,
  normalize = TRUE,
  add_coords = TRUE,
  verbose = TRUE
)
#> Added coordinates as features
#> Normalized features
#> Running maxvol algorithm...
#> Maxvol converged in 1 iterations

# 4. Check convergence
print(paste("Converged:", samples$converged))
#> [1] "Converged: TRUE"
print(paste("Iterations:", samples$iterations))
#> [1] "Iterations: 1"

# 5. Visualize
ss_plot_samples(samples)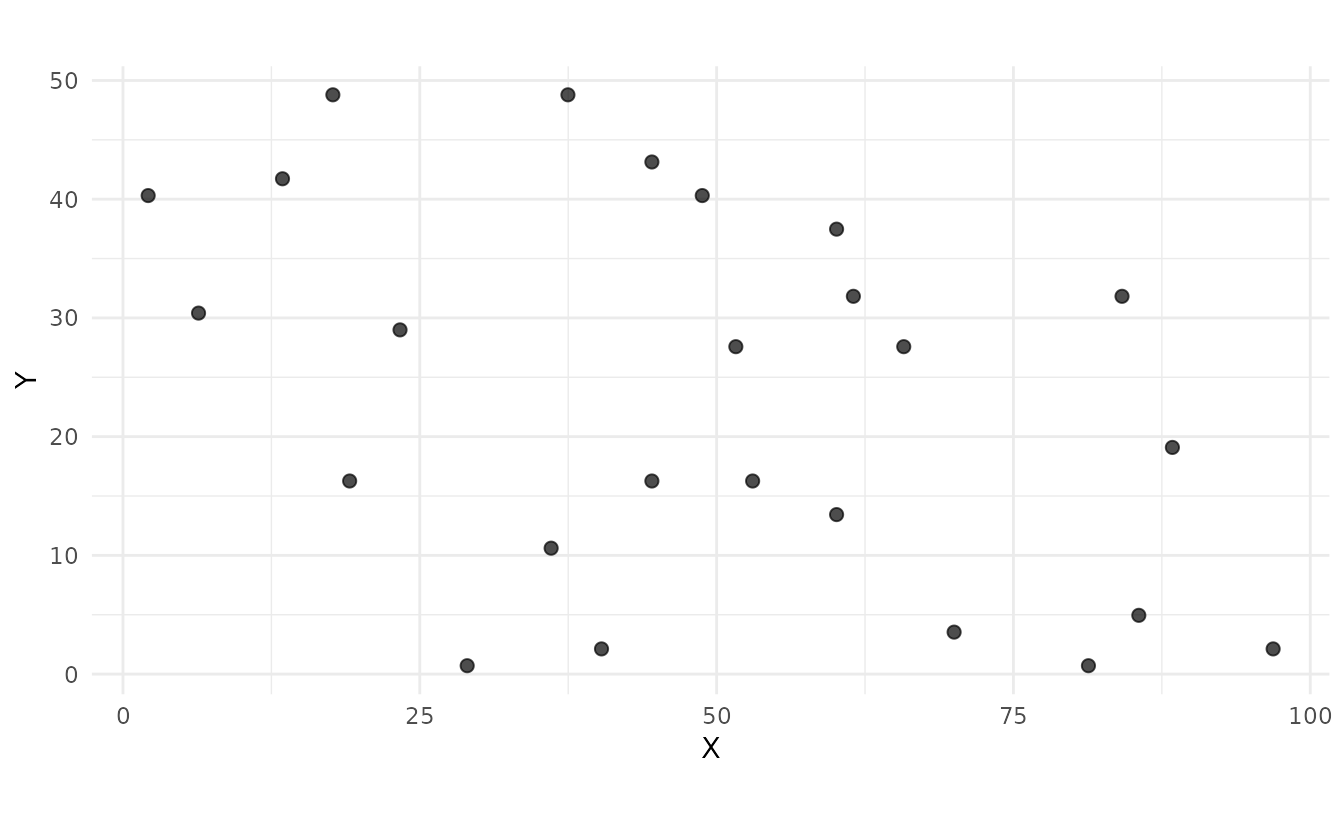
# 6. Get maxvol summary
summary_maxvol <- ss_summary.maxvol(samples)
#> Maxvol Optimal Design Sampling - Summary
#> =========================================
#>
#> Samples:
#>   Total samples: 25
#>   X range: 2.12 - 96.87
#>   Y range: 0.71 - 48.79
#>
#> Maxvol Algorithm:
#>   Features used: 6
#>   Feature names: elevation, slope, aspect, twi, X, Y
#>   Converged: TRUE
#>   Iterations: 1
print(summary_maxvol)
#> NA
#> NA
#> Number of samples: 25
6.5 Workflow 5: Composite Sampling
# 1. Create composite samples
set.seed(111)
samples <- ss_composite(
  study_area,
  n_strata = 30,
  n_composites = 4,
  n_try = 10
)

# 2. Visualize (different symbols per composite)
ss_plot_samples(samples)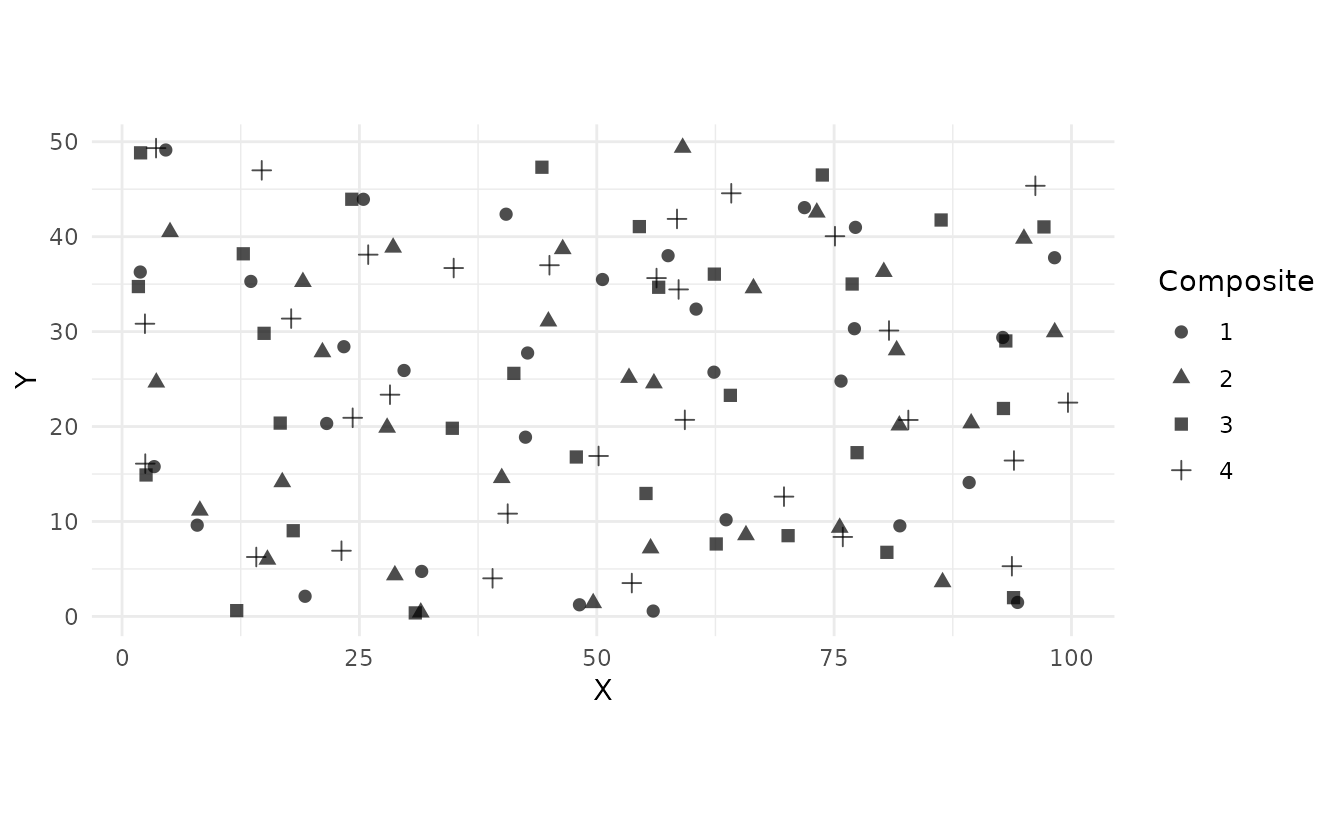
# 3. Get composite assignments
samples_sf <- ss_to_sf(samples)
table(samples_sf$composite_id)
#> < table of extent 0 >

# 4. Export by composite
coords <- ss_to_data_frame(samples)
head(coords)
#>   stratum_id sample_id composite        X        Y
#> 1          1         1         1 40.45178 42.36465
#> 2          1         2         2 46.41346 38.69992
#> 3          1         3         3 44.22392 47.31324
#> 4          1         4         4 45.01655 36.99218
#> 5          2         5         1 42.49344 18.87764
#> 6          2         6         2 39.99177 14.58974
6.6 Workflow 6: Working with Prior Points
# 1. Define existing sample locations
prior_points <- st_as_sf(
  data.frame(x = c(20, 80), y = c(15, 35)),
  coords = c("x", "y")
)

# 2. Create stratification around prior points
strata <- ss_stratify(
  study_area,
  n_strata = 23,  # Total will be 25 with 2 prior points
  prior_points = prior_points,
  n_try = 5
)

# 3. Sample at centroids
samples <- ss_coverage(strata)

# 4. Visualize (prior points shown differently)
ss_plot(strata, samples = samples)
# 5. Check which are prior points
samples_sf <- ss_to_sf(samples)
table(samples_sf$is_prior)
#>
#> FALSE  TRUE
#>    21     2
7. Exporting Results
7.1 Export to CSV
# Get coordinates as data frame
samples <- ss_coverage(study_area, n_strata = 25, n_try = 5)
coords <- ss_to_data_frame(samples)

# Write to CSV
write.csv(coords, "sampling_points.csv", row.names = FALSE)8. Comparison of Methods
8.1 Visual Comparison
# Set seed for consistency
set.seed(999)

# Random sampling
samples_random <- ss_random(study_area, n = 20)

# Stratified sampling
strata <- ss_stratify(study_area, n_strata = 20, n_try = 5)
samples_strat <- ss_stratified(strata, n_per_stratum = 1)

# Coverage sampling
samples_cov <- ss_coverage(study_area, n_strata = 20, n_try = 5)

# Composite sampling
samples_comp <- ss_composite(study_area, n_strata = 20, n_composites = 4)

# Note: Plotting would show the differences
# In practice, use plot() or ss_plot_samples() for each
8.2 When to Use Each Method
| Method | Best For | Advantages | Disadvantages |
|---|---|---|---|
ss_random() |
Simple designs | Easy to implement | May cluster |
ss_stratified() |
Design-based inference | Unbiased estimates | Requires good stratification |
ss_coverage() |
Spatial interpolation | Good spatial spread | Not random |
ss_maxvol() |
Feature diversity | Optimal for kriging | Needs feature data |
ss_composite() |
Cost reduction | Fewer lab analyses | Less spatial detail |
9. Tips and Best Practices
9.1 Choosing Number of Strata
# Rule of thumb: n_strata ≈ sqrt(study area / typical mapping unit)
# For our 5000 unit² area with ~100 unit² mapping units:
n_strata_suggested <- round(sqrt(5000 / 100))
print(paste("Suggested strata:", n_strata_suggested))
#> [1] "Suggested strata: 7"
9.2 Using Multiple Tries
# Always use n_try > 1 to avoid local optima
strata_few <- ss_stratify(study_area, n_strata = 25, n_try = 1)
strata_many <- ss_stratify(study_area, n_strata = 25, n_try = 10)

# Compare MSSD (lower is better)
print(paste("Few tries MSSD:", round(strata_few$mssd, 2)))
#> [1] "Few tries MSSD: 43.68"
print(paste("Many tries MSSD:", round(strata_many$mssd, 2)))
#> [1] "Many tries MSSD: 40.29"
9.3 Checking Convergence
strata <- ss_stratify(study_area, n_strata = 25, n_try = 5)

# Check if algorithm converged
print(paste("Converged:", strata$converged))
#> [1] "Converged: TRUE"
print(paste("Iterations:", strata$iterations))
#> [1] "Iterations: "
print(paste("MSSD:", round(strata$mssd, 2)))
#> [1] "MSSD: 41.06"
9.4 Reproducibility
# Always set seed for reproducible results
set.seed(42)
samples1 <- ss_random(study_area, n = 20)

set.seed(42)
samples2 <- ss_random(study_area, n = 20)

# Should be identical
coords1 <- st_coordinates(ss_to_sf(samples1))
coords2 <- st_coordinates(ss_to_sf(samples2))
identical(coords1, coords2)
#> [1] TRUE
10. Troubleshooting
10.1 Study Area Issues
# Empty geometry will fail
empty_poly <- st_polygon(list(matrix(numeric(0), ncol = 2)))
#> Error in `y[1, ]`:
#> ! subscript out of bounds
# ss_stratify(st_sf(geometry = st_sfc(empty_poly)), n_strata = 10)
10.2 Too Many Strata
# Too many strata for small area
# ss_stratify(study_area, n_strata = 10000, n_try = 5)
# Will warn about grid resolution
10.3 Maxvol Requirements
# n must be >= number of features
feature_mat <- matrix(rnorm(500), ncol = 5)
coords_mat <- cbind(x = 1:100, y = 1:100)

# This will fail: n < n_features
# ss_maxvol(feature_mat, n = 3, coords = coords_mat)

# This will work: n >= n_features
samples <- ss_maxvol(feature_mat, n = 10, coords = coords_mat)
#> Warning: Initial submatrix is rank deficient, attempting to improve selection
#> Error:
#> ! Cannot find linearly independent initial submatrix. Features may be too correlated or insufficient.
11. Advanced Topics
11.1 Custom Grid Resolution
# Higher resolution for detailed areas
strata_fine <- ss_stratify(
  study_area,
  n_strata = 25,
  n_cells = 5000,  # Default is ~2500
  n_try = 5
)

# Lower resolution for large areas
strata_coarse <- ss_stratify(
  study_area,
  n_strata = 25,
  n_cells = 1000,
  n_try = 5
)
11.2 Working with Real Shapefiles
# Read shapefile
study_area <- st_read("path/to/study_area.shp")

# Create sampling design
set.seed(42)
samples <- ss_coverage(study_area, n_strata = 50, n_try = 10)

# Export results
coords <- ss_to_data_frame(samples)
write.csv(coords, "sampling_points.csv", row.names = FALSE)

# Or export as spatial file
samples_sf <- ss_to_sf(samples)
st_write(samples_sf, "sampling_points.gpkg")
11.3 Integrating with Other Packages
# Use with terra for raster data
library(terra)
dem <- rast("dem.tif")

# Extract features at grid points
# ... (feature extraction code)

# Use maxvol for optimal sampling
samples <- ss_maxvol(
  feature_matrix,
  n = 50,
  coords = coordinates_matrix,
  normalize = TRUE
)
12. Function Reference Summary
Stratification
-
ss_stratify()- Create compact geographical strata
Sampling
-
ss_random()- Simple random sampling -
ss_stratified()- Stratified random sampling -
ss_coverage()- Spatial coverage sampling -
ss_coverage_equal_area()- Equal-area coverage sampling -
ss_maxvol()- Maxvol optimal design sampling -
ss_composite()- Composite sampling
Visualization
-
ss_plot()- Plot strata and/or samples -
ss_plot_samples()- Plot samples only -
plot.ss_strata()- S3 plot method for strata -
plot.ss_samples()- S3 plot method for samples
Information
-
ss_summary()- Get summary statistics -
ss_summary.maxvol()- Maxvol-specific summary -
print.ss_strata()- Print strata -
print.ss_samples()- Print samples -
summary.ss_strata()- Summary for strata -
summary.ss_samples()- Summary for samples
Utilities
-
ss_n_strata()- Get number of strata -
ss_n_samples()- Get number of samples -
ss_get_samples()- Extract samples as sf -
ss_to_sf()- Convert to sf object -
ss_to_data_frame()- Convert to data frame -
ss_area()- Get stratum areas -
ss_relative_area()- Get relative stratum areas
References
de Gruijter, J.J., Brus, D.J., Bierkens, M.F.P., and Knotters, M. (2006). Sampling for Natural Resource Monitoring. Springer, Berlin.
Walvoort, D.J.J., Brus, D.J., and de Gruijter, J.J. (2010). An R package for spatial coverage sampling and random sampling from compact geographical strata by k-means. Computers & Geosciences 36, 1261-1267.
Petrovskaia, N., Korveh, K., and Maas, E. (2021). Optimal soil sampling design based on the maxvol algorithm. Geoderma 381, 114733.