Creates a comprehensive 2x2 multi-panel visualization showing multiple aspects of the SQI analysis results. This function provides a quick overview of the analysis by displaying distribution, indicators, weights, and scree plots together.
Arguments
- sqi_result
An object of class "sqi_result" returned by
compute_sqi,compute_sqi_df, orcompute_sqi_properties.- ...
Additional graphical parameters passed to individual plot functions.
Details
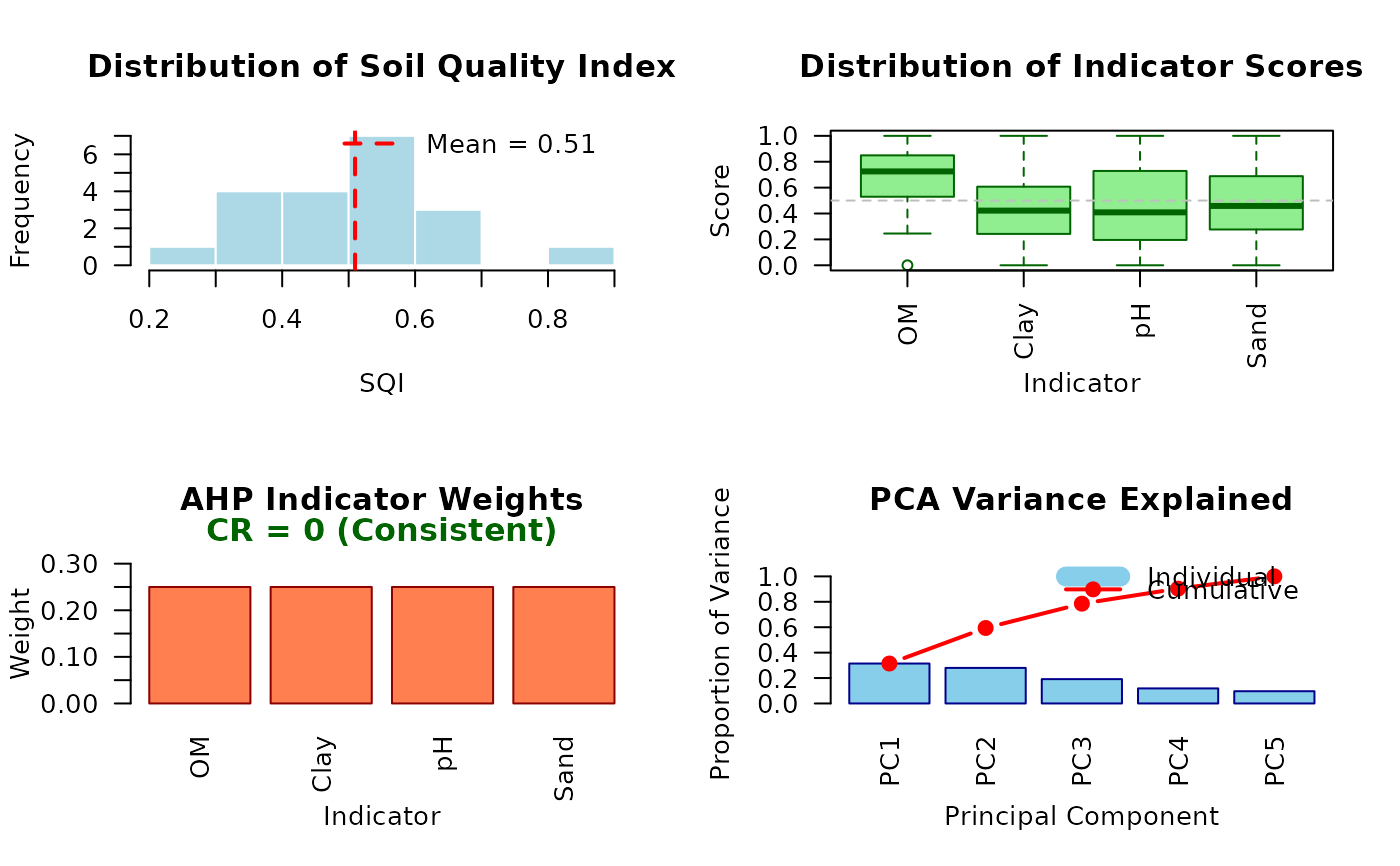
The function creates a 2x2 grid layout containing:
Top-left: SQI distribution histogram
Top-right: Indicator scores boxplots
Bottom-left: AHP weights bar chart
Bottom-right: PCA scree plot
The graphics parameters are automatically saved and restored after plotting, so the function does not affect subsequent plots.
See also
plot.sqi_result for individual plot types,
compute_sqi, compute_sqi_df,
compute_sqi_properties
Examples
# Create example data
soil_data <- data.frame(
  SampleID = paste0("S", 1:20),
  Sand = rnorm(20, 45, 10),
  Silt = rnorm(20, 30, 5),
  Clay = rnorm(20, 25, 5),
  pH = rnorm(20, 6.5, 0.5),
  OM = rnorm(20, 3, 0.5)
)

# Compute SQI
result <- compute_sqi_df(soil_data, id_column = "SampleID")

# Create comprehensive report
plot_sqi_report(result)